오늘은 CIFAR-10 데이터셋을 이용해서 컨볼루션 신경망(convolutional neural network, CNN) 기반의 이미지 분류기를 만들어보겠습니다. 지난 시간에 만든 CNN 기반 의상분류기와 사용하는 데이터셋을 제외하고는 사실상 동일합니다. 의상분류기 예제에서는 fashion mnist 데이터셋을 사용했었죠?
오늘 사용할 CIFAR-10 데이터셋에 대해 간략히 소개해드리겠습니다. 의상분류기를 만들기 위해 사용한 fashion mnist는 그레이스케일 이미지들로 구성되어 있었던 반면, CIFAR-10 데이터셋은 컬러 이미지들로 구성되어 있습니다. 총 6만개의 샘플을 갖고 있는데, 그 중 5만개는 훈련을 위한 것이고, 만개는 테스트를 위한 것입니다. CIFAR-10의 이미지들은 이름에서 나타나듯이 10개의 클래스에 속합니다. 비행기, 자동차, 새, 고양이, 사슴, 개, 개구리, 말, 배(ship), 트럭.
참고로 CIFAR-100 데이터셋도 있습니다. 오늘 사용하진 않을 것이지만.^^
전체 코드를 먼저 보여드릴테니, 저와 함께 같이 일단 한번 실행해보시길 권해드립니다. tensorflow, numpy, matplotlib 등을 설치하지 않으신 분들은 conda prompt에서 먼저 설치하셔야 합니다.^^ (아나콘다를 사용하신다면, conda install tensorflow로 설치하실 수 있습니다.) 만약 다른 개발 환경이시라면 그에 맞게 설치하시면 됩니다.
|
1
2
3
4
5
6
7
8
9
10
11
12
13
14
15
16
17
18
19
20
21
22
23
24
25
26
27
28
29
30
31
32
33
34
35
36
37
38
39
40
41
42
43
44
45
46
47
48
49
50
51
52
53
54
55
56
57
58
59
60
61
62
63
64
65
66
67
68
69
70
71
72
73
74
75
76
77
78
79
80
81
82
83
84
85
86
87
88
89
90
91
|
import numpy as np
import matplotlib.pyplot as plt
import tensorflow as tf
from tensorflow import keras
from tensorflow.keras import datasets, layers, models
cifar10 = datasets.cifar10
(train_images, train_labels), (test_images, test_labels) = cifar10.load_data()
class_names = ['airplane', 'automobile', 'bird', 'cat', 'deer', 'dog', 'frog', 'horse', 'ship', 'truck']
print("Train samples:", train_images.shape, train_labels.shape)
print("Test samples:", test_images.shape, test_labels.shape)
train_images = train_images.reshape((50000, 32, 32, 3))
test_images = test_images.reshape((10000, 32, 32, 3))
plt.figure(figsize=(10, 10))
for i in range(25):
plt.subplot(5, 5, i+1)
plt.xticks([])
plt.yticks([])
plt.grid(False)
plt.imshow(train_images[i])
plt.xlabel(class_names[train_labels[i][0]])
plt.show()
train_images = train_images/255.0
test_images = test_images/255.0
model = models.Sequential()
model.add(layers.Conv2D(32, (3, 3), activation='relu', input_shape=(32, 32, 3)))
model.add(layers.MaxPooling2D((2, 2)))
model.add(layers.Conv2D(64, (3, 3), activation='relu'))
model.add(layers.MaxPooling2D((2, 2)))
model.add(layers.Conv2D(64, (3, 3), activation='relu'))
model.add(layers.Flatten())
model.add(layers.Dense(64, activation='relu'))
model.add(layers.Dense(10, activation='softmax'))
model.compile(optimizer='adam', loss='sparse_categorical_crossentropy', metrics=['accuracy'])
model.fit(train_images, train_labels, epochs=10)
test_loss, test_acc = model.evaluate(test_images, test_labels)
print('Test accuracy:', test_acc)
predictions = model.predict(test_images)
def plot_image(i, predictions_array, true_label, img):
predictions_array, true_label, img = predictions_array[i], true_label[i], img[i]
plt.grid(False)
plt.xticks([])
plt.yticks([])
plt.imshow(img, cmap=plt.cm.binary)
predicted_label = np.argmax(predictions_array)
if predicted_label == true_label:
color = 'blue'
else:
color = 'red'
plt.xlabel("{} {:2.0f}% ({})".format(class_names[predicted_label],
100*np.max(predictions_array),
class_names[true_label[0]]),
color=color)
def plot_value_array(i, predictions_array, true_label):
predictions_array, true_label = predictions_array[i], true_label[i]
plt.grid(False)
plt.xticks([])
plt.yticks([])
thisplot = plt.bar(range(10), predictions_array, color="#777777")
plt.ylim([0, 1])
predicted_label = np.argmax(predictions_array)
thisplot[predicted_label].set_color('red')
thisplot[true_label[0]].set_color('blue')
i = 0
plt.figure(figsize=(6,3))
plt.subplot(1,2,1)
plot_image(i, predictions, test_labels, test_images)
plt.subplot(1,2,2)
plot_value_array(i, predictions, test_labels)
plt.show()
|
cs |
코드를 실행한 결과 출력된 내용은 다음과 같습니다.


테스트 결과 예측 정확도는 0.7089였습니다. 그렇게 높은 것은 아니지만, 대충 만든 모델치고는 그럭저럭 괜찮아보입니다. 참고로 이 포스팅의 목적은 완벽한 모델을 만드는 것이 아니라, 이미지 분류를 위한 CNN 모델을 만드는 전체 과정을 보여드리기 위함이니 성능을 높이기 위한 과정은 생략하겠습니다.^^
이제 위 코드를 블럭 단위로 하나하나 설명드리겠습니다.

먼저 CIFAR-10 데이터셋을 불러와서 사용할 수 있도록 준비해줍니다.

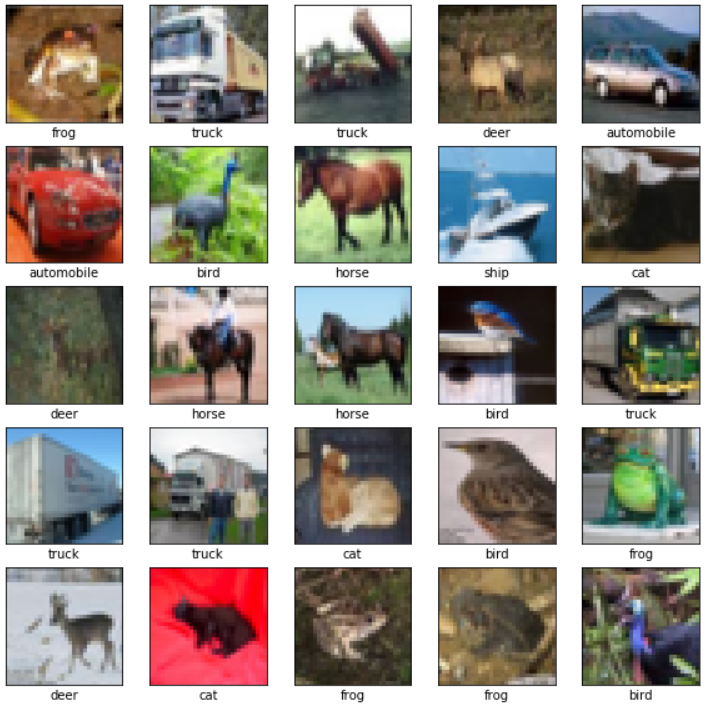
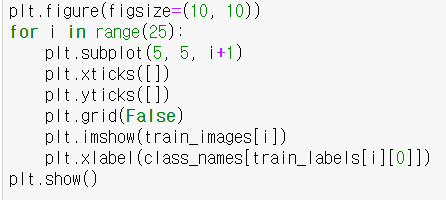
훈련셋 내 처음 25개의 이미지가 어떻게 생겼는지 확인합니다.

0~255의 픽셀값을 갖는 이미지들을 CNN 모델에 입력해주기 위해 0~1의 값을 갖도록 조정해줍니다.

가장 중요한 부분 중의 하나죠? CNN 모델의 구조를 결정해줍니다. 3개의 컨볼루션 층과 2개의 Fully-connected(FC) 층을 갖도록 만들었습니다. 10개의 클래스를 분류해야하는 모델이므로 마지막 FC 층은 10개의 노드를 갖고 활성화함수로 softmax 함수를 사용합니다.

훈련방식을 결정한 다음에 훈련셋을 이용해서 모델을 훈련시킵니다. epoch는 10으로 설정했습니다.

테스트셋을 이용해서 훈련된 모델의 성능을 평가합니다. Test accuracy는 위에서 말씀드린대로 0.7089가 나왔습니다.

테스트 이미지들을 가지고 예측을 실행합니다. 물론 위에서 이미 예측을 했지만, 이 코드는 실제로 예측된 클래스들을 확인하기 위한 것입니다.

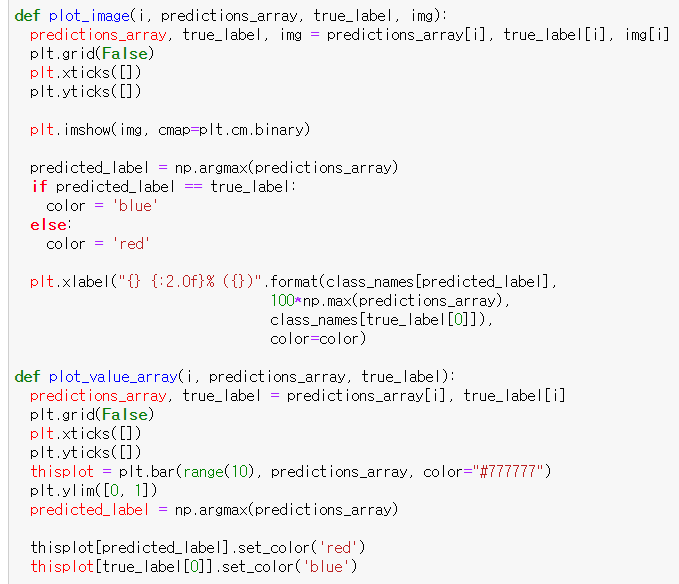
예측 결과를 그래프로 보여주기 위한 함수들을 만들어줍니다.

테스트셋의 첫번째 이미지에 대한 예측 결과를 확인합니다.
각 블럭에 대해 설명했는데 대강 이해가 되셨나요? 구체적으로는 모르셔도 괜찮습니다. 무엇을 하는 블럭인지만 아셔도 충분합니다.^^
오늘 글은 여기서 매조짓겠습니다. 끝까지 읽어주셔서 감사합니다. 항상 질문과 지적은 환영합니다. 댓글로 남겨주시면 최대한 빠르게 답변드리겠습니다.
<참고자료>
[1] https://www.tensorflow.org/tutorials/keras/classification?hl=ko, TensorFlow, "첫 번째 신경망 훈련하기: 기초적인 분류 문제"
'Dev > python' 카테고리의 다른 글
| [python] numpy 패키지 유용한 함수들 10개 정리 (0) | 2020.02.20 |
|---|---|
| [python] 산술 연산자(+, -, *, /, %, //, **) (2) | 2020.02.20 |
| [Anaconda+python] GMSD의 matlab 코드를 python으로 작성하기 (1) | 2020.02.20 |
| 텐서플로와 케라스에 대한 짧은 정리 (2) | 2020.02.07 |
| [Anaconda+python] 의상 분류기 만들어서 훈련시키고 테스트하기2(컨볼루션 신경망) (12) | 2020.02.05 |
| [Anaconda+python] 의상 분류기 만들어서 훈련시키고 테스트하기1(인공신경망) (10) | 2020.02.01 |
| [ubuntu+python] 이미지 속 문자 인식한 것을 음성 파일로 변환해주기 (0) | 2020.01.22 |
| [ubuntu+python] 이미지 속 문자 검출 및 인식하기(OCR) (2) | 2020.01.21 |