안녕하세요. 비스카이비전입니다.
matplotlib를 활용하여 그래프를 그리면 대략 다음과 같은 스타일로 그래프가 그려집니다.
import pandas as pd
import matplotlib.pyplot as plt

df = pd.DataFrame([[1, 5], [2, 2], [3, 7], [4, 9], [5, 6]])

plt.plot(df[0], df[1])
plt.grid(True)
plt.title('title')
plt.xlabel('xlabel')
plt.ylabel('ylabel')
plt.show()

이런 스타일의 그래프도 충분히 심플하고 예쁩니다. 하지만 한 줄의 코드만 삽입하면, 완전히 다른 느낌의 그래프를 그릴 수 있습니다. matplotlib에서 제공하는 그래프의 스타일을 확인하기 위한 코드는 다음과 같습니다.
import matplotlib.pyplot as plt

print(plt.style.available)
위 코드를 실행하면 적용할 수 있는 다양한 스타일들이 리스트에 담겨 있는 것을 확인할 수 있습니다.
['Solarize_Light2', '_classic_test_patch', '_mpl-gallery', '_mpl-gallery-nogrid', 'bmh', 'classic', 'dark_background', 'fast', 'fivethirtyeight', 'ggplot', 'grayscale', 'seaborn', 'seaborn-bright', 'seaborn-colorblind', 'seaborn-dark', 'seaborn-dark-palette', 'seaborn-darkgrid', 'seaborn-deep', 'seaborn-muted', 'seaborn-notebook', 'seaborn-paper', 'seaborn-pastel', 'seaborn-poster', 'seaborn-talk', 'seaborn-ticks', 'seaborn-white', 'seaborn-whitegrid', 'tableau-colorblind10']
다양한 스타일로 그래프를 그려보자
fivethirtyeight 스타일
이 중에서 저는 제가 좋아하는 네이트실버의 fivethirtyeight 스타일을 적용해보겠습니다.
import pandas as pd
import matplotlib.pyplot as plt

print(plt.style.available)

df = pd.DataFrame([[1, 5], [2, 2], [3, 7], [4, 9], [5, 6]])

plt.style.use('fivethirtyeight')
plt.plot(df[0], df[1])
plt.grid(True)
plt.title('title')
plt.xlabel('xlabel')
plt.ylabel('ylabel')
plt.show()
이전 코드에서 plt.style.use('fivethirtyeight') 한 줄의 코드만 삽입되었습니다. 디폴트 스타일과는 또 느낌이 많이 다르죠?

classic 스타일
이번에는 classic 스타일을 적용해보겠습니다. plt.style.use('fivethirtyeight')를 plt.style.use('classic')으로 변경하시기만 하면 됩니다. 그리드가 점선으로 처리되어 좀 더 깔끔한 느낌이 드네요.

dark_background 스타일
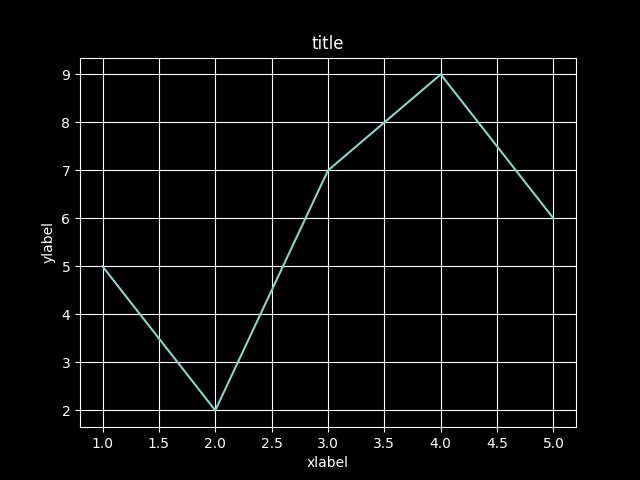
마지막으로 하나만 더해보겠습니다. dark_background 스타일을 적용해보겠습니다. 멋지죠?

위 리스트에 있는 다양한 스타일을 직접 적용해보시면서 현재 그래프가 사용될 문서 또는 사이트에 어울리는 스타일을 잘 찾으시면 되겠습니다.
'Dev > python' 카테고리의 다른 글
| [pandas, matplotlib] EPL 빅6 팀의 2010년 이후 순위 비교 그래프 그리기(선 그래프, 막대 그래프) (0) | 2022.06.28 |
|---|---|
| [pandas] 데이터프레임 컬럼명 또는 행 인덱스 바꾸는 방법 (0) | 2022.06.28 |
| [matplotlib] 그래프에 화살표 및 텍스트 삽입하기 (0) | 2022.06.27 |
| [matplotlib] 그래프의 y축 범위 지정하는 방법 (0) | 2022.06.27 |
| [pandas 오류 해결] TypeError: read_excel() got an unexpected keyword argument 'fillna' (0) | 2022.06.26 |
| [matplotlib] 그래프 여러 개 서브플롯(subplot)으로 그리기 (0) | 2022.06.21 |
| [python + pandas] 데이터프레임에서 특정 기간의 데이터 추출하기 (0) | 2022.06.21 |
| [pandas] 데이터프레임의 특정 컬럼을 행 인덱스로 설정하는 방법, set_index() (0) | 2022.06.08 |